Decoding Barometers: The Importance of Understanding Pressure Changes
May 7th, 2024 by team

Part I, of iNavX’s Multi-Part Weather Series
by B.J. Porter (Contributing Editor)
Barometer, n.: An ingenious instrument which indicates what kind of weather we are having.
Ambrose Bierce
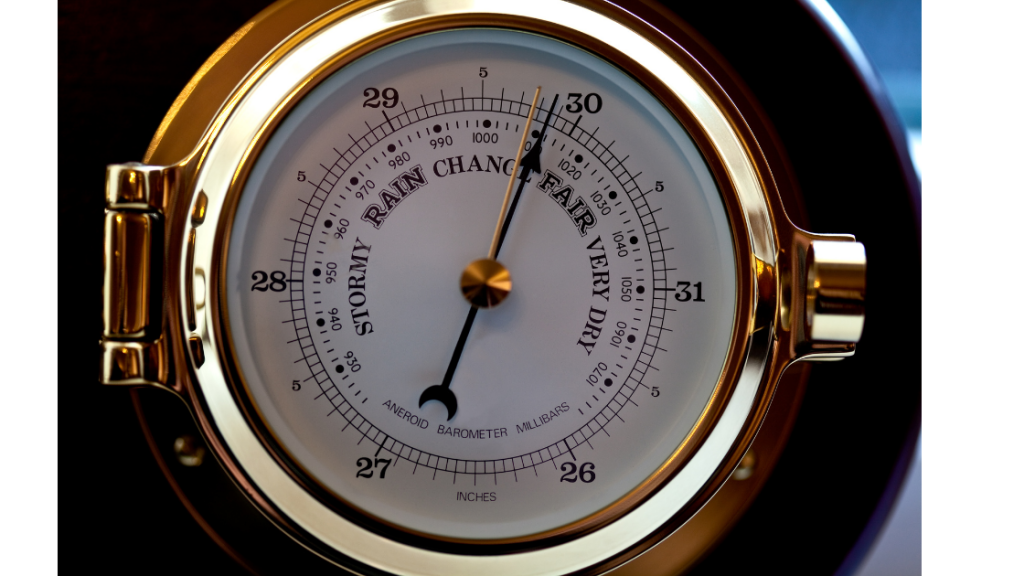
If you just look at a barometer once, it’s pretty much as satirist Ambrose Bierce described. The needle on the front of that old school brass barometer points to “Fair,” and when you look outside, sure enough, it’s not a bad day. When it says “Rain,” often enough, it’s raining or about to.
That doesn’t sound very useful. And the truth is, it isn’t helpful to just look at one reading. What makes barometers useful as a forecasting device is the trend in the readings. Are they going up or down over time, and how quickly? And to know that, you need to pay a little more attention to what they’re doing. And you need to know why the readings are changing and what that portends.
Welcome to Weather 101. Over the next few months we’re going to tackle some weather fundamentals to help boaters get a more solid understanding of marine weather, and how to look at a bewildering array of data to determine if you want to go out in your boat, and what to expect when you’re there.
What is a barometer?
A barometer measures atmospheric pressure. It’s a measurement of the weight of the atmosphere directly over where the barometer is sitting.
The earth’s atmosphere is about 60 miles thick around the surface of the planet. It’s a thin layer relative to the size of the planet, but air has weight and square inch of the surface has pressure from that invisible column of air over it. And that is atmospheric pressure.
But atmospheric pressure isn’t uniform. The earth isn’t completely flat, for starters. If you’re on the top of a one-mile tall summit, you have one mile less atmosphere over your head, and a barometer will show a slightly lower reading as you climb. But for boaters on the ocean, we’re mostly at sea level, so the pressures are pretty consistent.
The other variables are the conditions of the air itself. The earth spins, and the atmosphere is only attached to the surface by friction. So it’s dragged along by friction with the spinning. This creates a lot of circular currents to create Coriolis effect, which we’ll get to in more detail in a later post. The Coriolis effect in the atmosphere is a defining force in our weather patterns.
But the important thing to note is that the atmosphere is constantly swirling and moving, and isn’t even remotely close to uniform. There are enormous masses of air with different temperatures, densities and motion moving through the atmosphere like the vegetables and meat in a stew.
Air changes density easily. Warm air is lighter and cold air is heavier. So a mass of air moving over a desert will warm, and warm air moving over the ocean typically cools. But air masses are enormous, and the energy to change their temperatures is huge. When they move, collide, and overtake each other, you get some interesting weather.
Barometer Readings
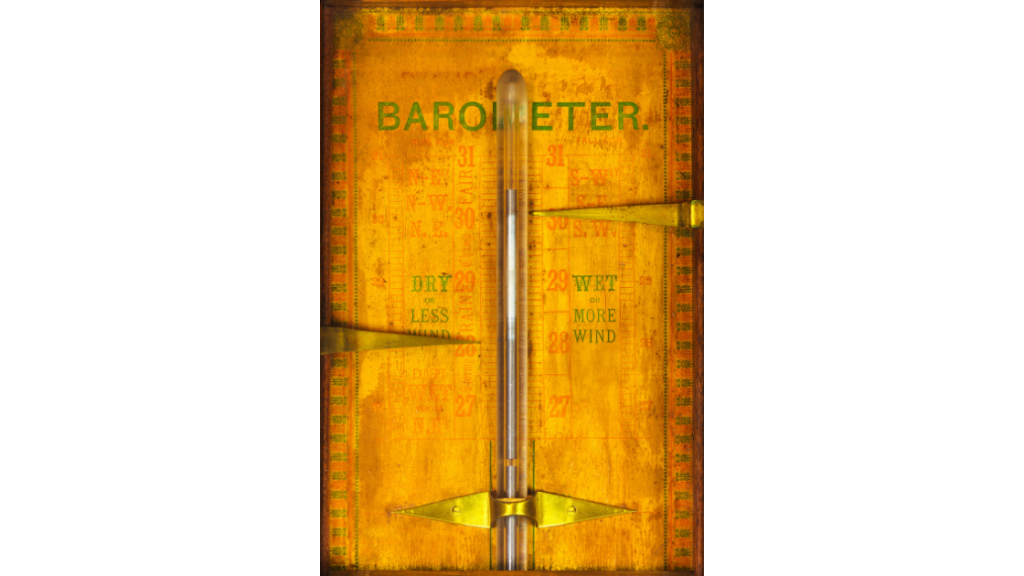
Early barometers used liquid mercury suspended in a tube or column with a vacuum at the top. The inventor, Evangelista Torricelli, noted that changes in atmospheric pressure moved the mercury up and down the tube as it changed. Making marks on the tube and taking measurements gave him the ability to track the atmospheric changes.
Because the first barometers used mercury, people often give readings in measurements of mercury, whether they are millimeters or inches. By the time Lucien Vidi invented the aneroid barometer, people had been noting pressure in inches of mercury for years.
Over time, scientists and meteorologists added additional measurements more directly related to pressure and standardized units, such as the Pascal (Pa), pounds per square inch (PSI), and millibars (mb). And one atmosphere (atm) is the mean (average) pressure at sea level.
Depending on where you are in the world and where you get your weather, you may see any of these units. Note that most modern electronic barometers let you pick your units to display.
These units are the same amount of pressure, normal atmospheric pressure at sea level, expressed in many different ways.
| Unit | Abbreviation | Amount | Description |
|---|---|---|---|
| Atmopshere | atm | 1.0 atm | |
| Pascals | Pa | 101,325 Pa | 1 Newton / Square Meter |
| Hectopascals | hPa | 1,013.25 hPa | 100 Pascals |
| Bar | bar | 1.013 bar | 1 Bar = pressure at 111 meters altitude and 15°C |
| Millibar | mbar | 1,013 mbar | 1/1000th of a Bar, conveniently the same as a hPa. |
| Inches of Mercury | inches Hg | 29.2212 inches Hg | |
| mm of Mercury | mm Hg | 760 mm Hg | |
| Pounds/Square Inch | psi | 14.7 psi |
For marine weather, you’ll mostly see millibars on NOAA weather charts. It’s precise, doesn’t involve decimals, and normal atmospheric pressure is close to 1,000 which is easy to remember.
The Meaning of Pressure
So what makes pressure high, and what makes it low? There are several factors, but the temperature of the air mass over where you’re reading is the most dominant. Warm air is less dense and holds more moisture, and colder air is more dense. More dense air overhead equals more weight pressing down and more pressure. And the opposite holds for less dense.
High pressure is usually associated with cool, drier air and low pressure air masses are warmer and wetter. And this translates directly into that pointer that says “fair” or “cloudy” that we discussed earlier. If it’s a cool cloudless day, odds are pretty good the barometer is reading on the higher side of 1,013 mbar.
If a high pressure system is coming, you can expect the weather to clear and cool off. But if a low pressure system is on the way, you can look for rain and warmer weather.
Of course, this isn’t absolute, since air masses of different pressures are constantly in motion. And they travel at different speeds, often bumping in to one another, or even passing up and over or around each other. These interactions are called “fronts” and are a topic for a later article.
Tracking Changes

Tracking barometric change is easy enough. The most basic tool is a pen and pencil. Throughout the day, make a note of the time and the pressure reading. By your second or third reading, you’ll know the direction it’s moving. After a few more readings, you’ll have an idea of how quickly it’s changing.
Of course, there are easier ways. Aneroid dial barometers usually have a moveable arrow you can set on the current pressure. If you know when you last set it, you can clearly see how much the pressure arrow has moved. Setting the pointer at the same time every day isn’t a bad habit.
More sophisticated older barometers had a pen and a paper drum which slowly rotated as the pen moved with the pressure. This created a nice plot of the pressure. Modern electronic barometers can do much better, keeping an electronic record for days and storing it for you. You can even set them with alarms for sudden pressure changes or changes.
Today, smart watches and cell phones often have barometers, and barometer apps can track changes and alerts for you. Just make sure you turn the app on and get it tracking before you plan to sail. Remember how pressure changes with altitude? If your phone or watch has an “Altimeter,” odds are good that’s just a barometer programmed to estimate your altitude, so there may be a barometer app which can use it.
Interpreting change

So how do you pull this all together to convert the marginally useful single barometer reading into a practical tool for predicting the weather?
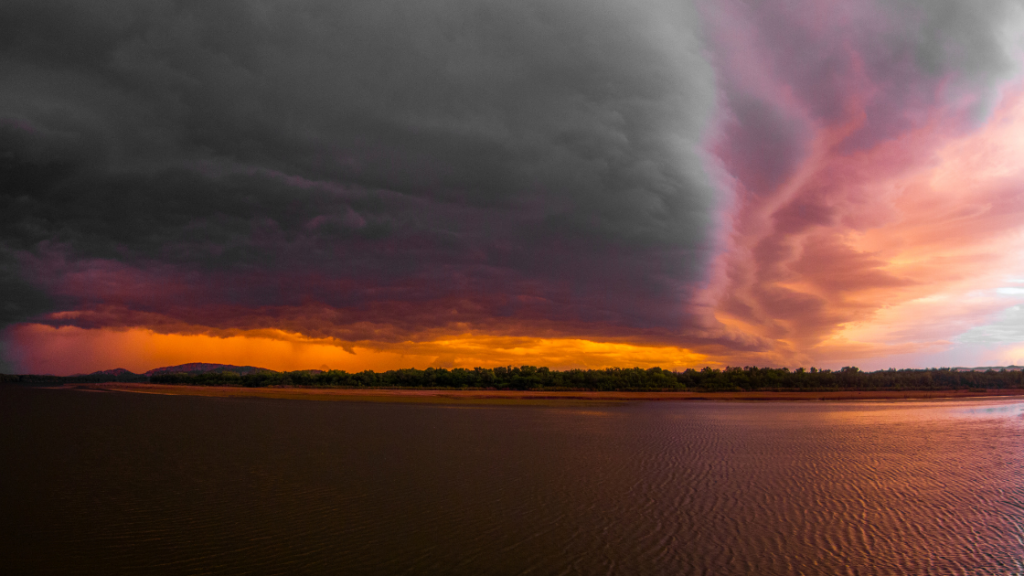
You watch the barometer readings, and you track the changes. You’re looking at the amount of change, and the rate of change. If the barometer is rising, expect a high pressure system. If it’s falling, you’re probably headed for rain or stormy weather.
The faster it falls, the more likely the weather will be bad, and a large, sudden drop in pressure shows a storm on the way. Lower pressure usually correlates directly with storm intensity. Hurricane Wilma in 2005 registered a record low of 882 mbar!
If you see a drop faster than 1 mbar/hour, prepare for possible rough weather. And batten everything down if it’s dropping 6-10 mbar over three hours!

May 11, 2024 at 6:47 pm, Carl Stevens said:
Your first table and the previous sentence introducing it is confusing. First, it states “these pressures are the same…at sea level, 1 atm…expressed in different ways. But the table seems to contradict that:
“1 Bar = pressure at 111 meters at 15 degrees C” Shouldn’t read at “sea lever”, roughly?
I thought 1 Bar = 1 atm = 1000 mbar
January 30, 2025 at 5:35 am, Amanda said:
Fascinating read! 🌦️ Understanding pressure changes and how barometers work is so important, especially for weather enthusiasts and outdoor adventurers. This blog does a great job breaking down the science in an easy-to-digest way. Thanks for sharing such valuable insights! 📊🌍 If you’re looking for more tools or resources, check out https://chsmith.com.au/—they might have something to help you!