Using Charts
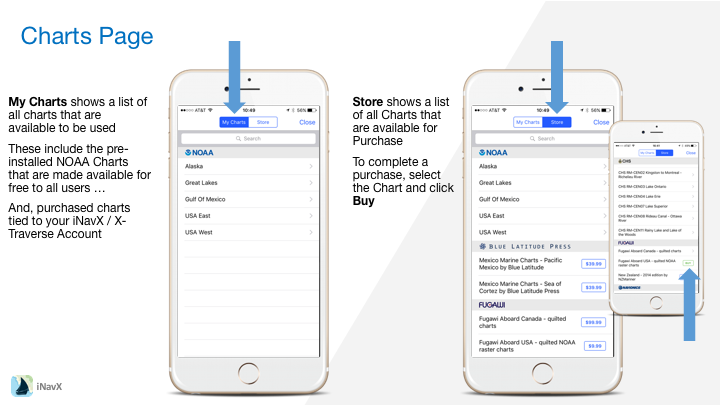
My Charts shows a list of all charts that are available to be used.These include the pre-installed NOAA Charts that are made available for free to all users … And, purchased charts tied to your iNavX / X-Traverse Account.
Store shows a list of all Charts that are available for Purchase. To complete a purchase, select the Chart and click Buy.
Logging into X-Traverse Account
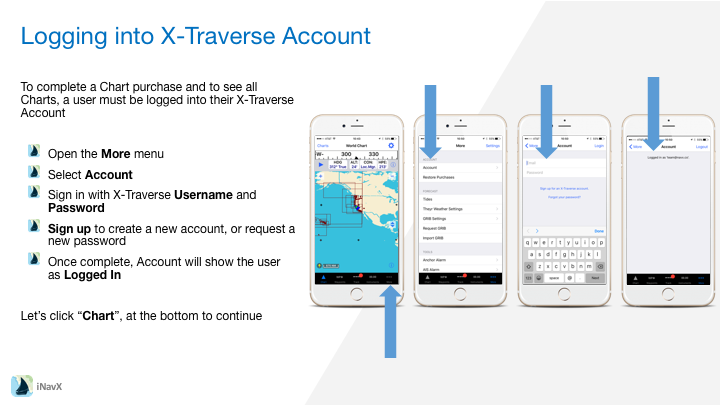
To complete a Chart purchase and to see all Charts, a user must be logged into their X-Traverse Account:
– Open the More menu
– Select Account
– Sign in with X-Traverse Username and Password
– Sign up to create a new account, or request a new password
– Once complete, Account will show the user as Logged In
Let’s click “Chart”, at the bottom to continue
Opening a Chart
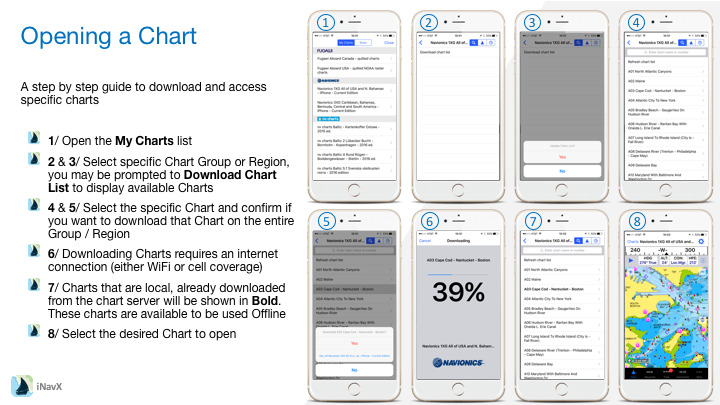
A step by step guide to download and access specific charts:
– Open the My Charts list
– Select specific Chart Group or Region, you may be prompted to Download Chart List to display available Charts
– Select the specific Chart and confirm if you want to download that Chart on the entire Group / Region
– Downloading Charts requires an internet connection (either WiFi or cell coverage)
– Charts that are local, already downloaded from the chart server will be shown in Bold. These charts are available to be used Offline
– Select the desired Chart to open
Selecting Charts
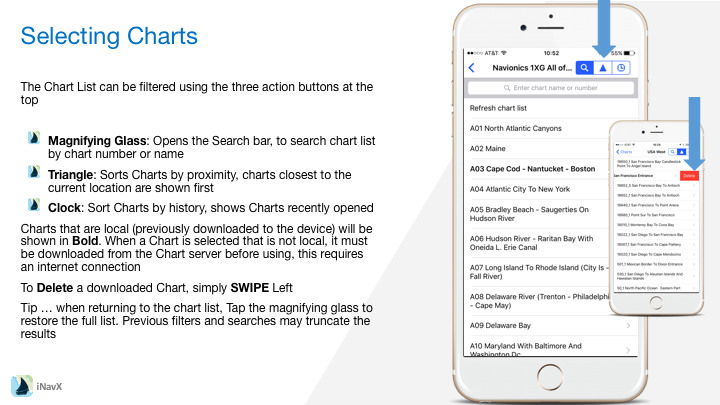
The Chart List can be filtered using the three action buttons at the top
– Magnifying Glass: Opens the Search bar, to search chart list by chart number or name
– Triangle: Sorts Charts by proximity, charts closest to the current location are shown first
– Clock: Sort Charts by history, shows Charts recently opened
Charts that are local (previously downloaded to the device) will be shown in Bold. When a Chart is selected that is not local, it must be downloaded from the Chart server before using, this requires an internet connection.
To Delete a downloaded Chart, simply SWIPE Left.
Tip … when returning to the chart list, Tap the magnifying glass to restore the full list. Previous filters and searches may truncate the results.
Understanding the Charts View Screen
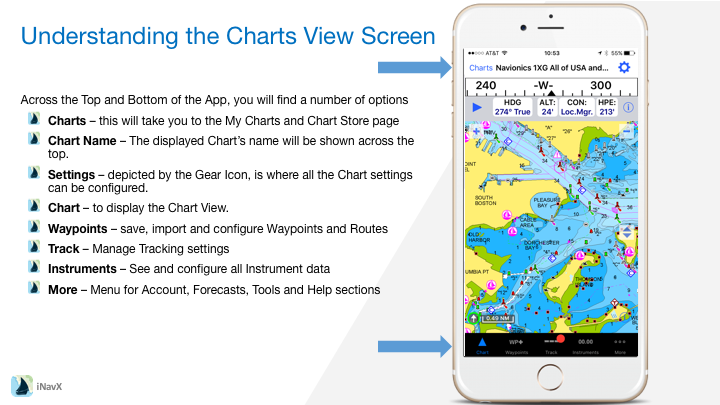
Across the Top and Bottom of the App, you will find a number of options
– Charts – this will take you to the My Charts and Chart Store page
– Chart Name – The displayed Chart’s name will be shown across the top.
– Settings – depicted by the Gear Icon, is where all the Chart settings can be configured.
– Chart – to display the Chart View.
– Waypoints – save, import and configure Waypoints and Routes
– Track – Manage Tracking settings
– Instruments – See and configure all Instrument data
– More – Menu for Account, Forecasts, Tools and Help sections
Using Charts
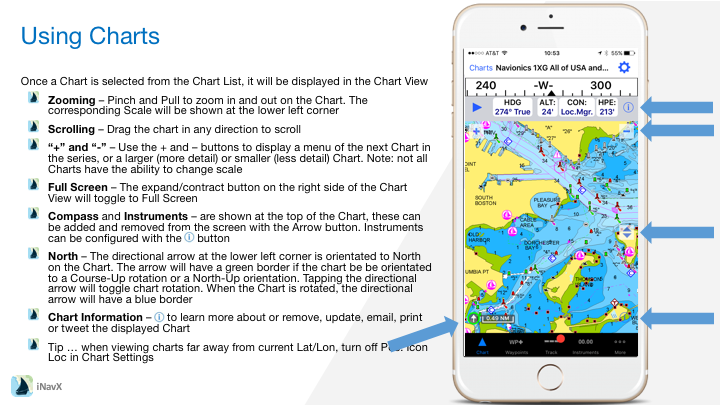
Once a Chart is selected from the Chart List, it will be displayed in the Chart View
– Zooming – Pinch and Pull to zoom in and out on the Chart. The corresponding Scale will be shown at the lower left corner
– Scrolling – Drag the chart in any direction to scroll
– “+” and “-” – Use the + and – buttons to display a menu of the next Chart in the series, or a larger (more detail) or smaller (less detail) Chart. Note: not all Charts have the ability to change scale
– Full Screen – The expand/contract button on the right side of the Chart View will toggle to Full Screen
– Compass and Instruments – are shown at the top of the Chart, these can be added and removed from the screen with the Arrow button. Instruments can be configured with the “i” button
– North – The directional arrow at the lower left corner is orientated to North on the Chart. The arrow will have a green border if the chart be be orientated to a Course-Up rotation or a North-Up orientation. Tapping the directional arrow will toggle chart rotation. When the Chart is rotated, the directional arrow will have a blue border
– Chart Information – “i” to learn more about or remove, update, email, print or tweet the displayed Chart
– Tip … when viewing charts far away from current Lat/Lon, turn off Pos. Icon Loc in Chart Settings
Location Details
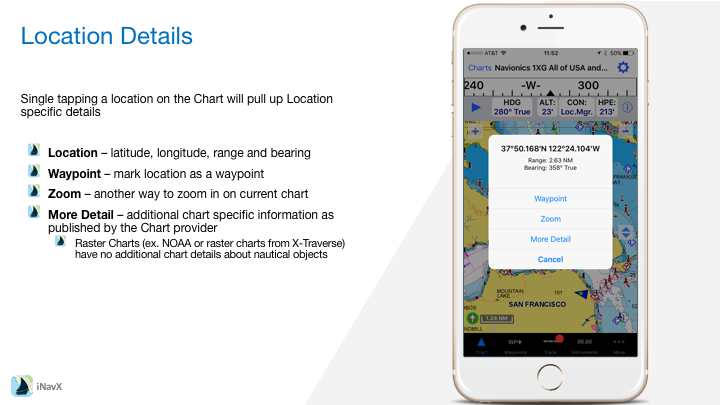
Single tapping a location on the Chart will pull up Location specific details
– Location – latitude, longitude, range and bearing
– Waypoint – mark location as a waypoint
– Zoom – another way to zoom in on current chart
– More Detail – additional chart specific information as published by the Chart provider
– Raster Charts (ex. NOAA or raster charts from X-Traverse) have no additional chart details about nautical objects