Chart Settings
| Settings | When Enables | ||
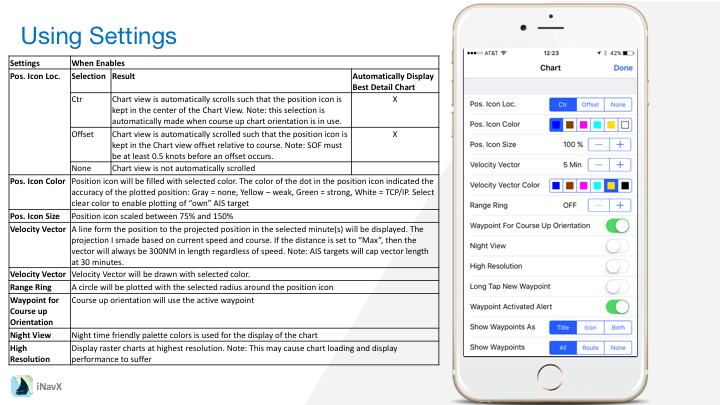
| Pos. Icon Loc. | Selection | Result | Automatically Display Best Detail Chart |
| Ctr | Chart view is automatically scrolls such that the position icon is kept in the center of the Chart View. Note: this selection is automatically made when course up chart orientation is in use. | X | |
| Offset | Chart view is automatically scrolled such that the position icon is kept in the Chart view offset relative to course. Note: SOF must be at least 0.5 knots before an offset occurs. | X | |
| None | Chart view is not automatically scrolled | ||
| Pos. Icon Color | Position icon will be filled with selected color. The color of the dot in the position icon indicated the accuracy of the plotted position: Gray = none, Yellow – weak, Green = strong, White = TCP/IP. Select clear color to enable plotting of “own” AIS target | ||
| Pos. Icon Size | Position icon scaled between 75% and 150% | ||
| Velocity Vector | A line form the position to the projected position in the selected minute(s) will be displayed. The projection I smade based on current speed and course. If the distance is set to “Max”, then the vector will always be 300NM in length regardless of speed. Note: AIS targets will cap vector length at 30 minutes. | ||
| Velocity Vector | Velocity Vector will be drawn with selected color. | ||
| Range Ring | A circle will be plotted with the selected radius around the position icon | ||
| Waypoint for Course up Orientation | Course up orientation will use the active waypoint | ||
| Night View | Night time friendly palette colors is used for the display of the chart | ||
| High Resolution | Display raster charts at highest resolution. Note: This may cause chart loading and display performance to suffer | ||
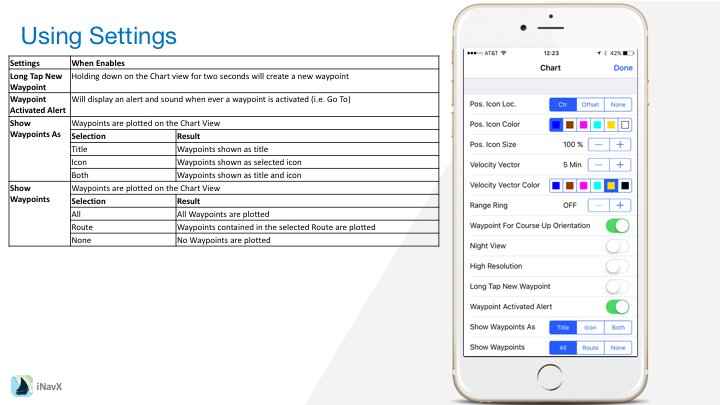
| Long Tap New Waypoint | Holding down on the Chart view for two seconds will create a new waypoint | |
| Waypoint Activated Alert | Will display an alert and sound when ever a waypoint is activated (i.e. Go To) | |
| Show Waypoints As | Waypoints are plotted on the Chart View | |
| Selection | Result | |
| Title | Waypoints shown as title | |
| Icon | Waypoints shown as selected icon | |
| Both | Waypoints shown as title and icon | |
| Show Waypoints | Waypoints are plotted on the Chart View | |
| Selection | Result | |
| All | All Waypoints are plotted | |
| Route | Waypoints contained in the selected Route are plotted | |
| None | No Waypoints are plotted | |
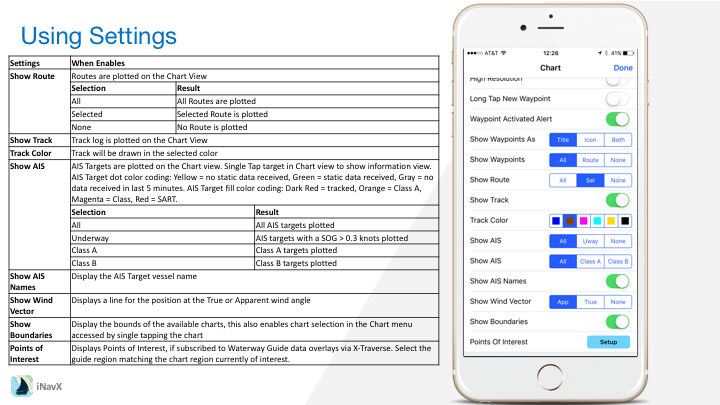
| Show Route | Routes are plotted on the Chart View | ||
| Selection | Result | ||
| All | All Routes are plotted | ||
| Selected | Selected Route is plotted | ||
| None | No Route is plotted | ||
| Show Track | Track log is plotted on the Chart View | ||
| Track Color | Track will be drawn in the selected color | ||
| Show AIS | AIS Targets are plotted on the Chart view. Single Tap target in Chart view to show information view. AIS Target dot color coding: Yellow = no static data received, Green = static data received, Gray = no data received in last 5 minutes. AIS Target fill color coding: Dark Red = tracked, Orange = Class A, Magenta = Class, Red = SART. | ||
| Selection | Result | ||
| All | All AIS targets plotted | ||
| Underway | AIS targets with a SOG > 0.3 knots plotted | ||
| Class A | Class A targets plotted | ||
| Class B | Class B targets plotted | ||
| Show AIS Names | Display the AIS Target vessel name | ||
| Show Wind Vector | Displays a line for the position at the True or Apparent wind angle | ||
| Show Boundaries | Display the bounds of the available charts, this also enables chart selection in the Chart menu accessed by single tapping the chart | ||
| Points of Interest | Displays Points of Interest, if subscribed to Waterway Guide data overlays, select the guide region matching the chart region currently of interest. | ||
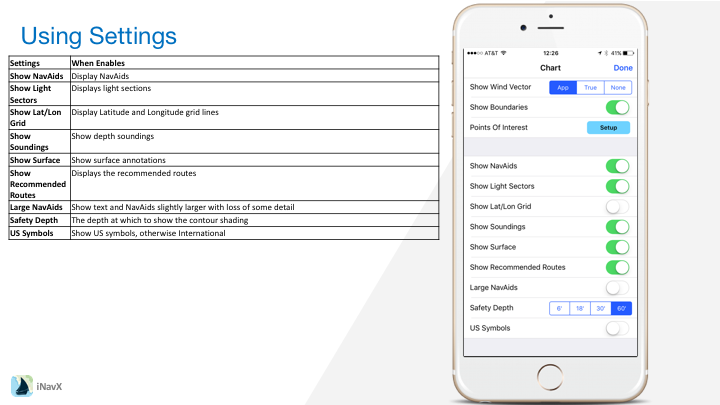
| Show NavAids | Display NavAids |
| Show Light Sectors | Displays light sections |
| Show Lat/Lon Grid | Display Latitude and Longitude grid lines |
| Show Soundings | Show depth soundings |
| Show Surface | Show surface annotations |
| Show Recommended Routes | Displays the recommended routes |
| Large NavAids | Show text and NavAids slightly larger with loss of some detail |
| Safety Depth | The depth at which to show the contour shading |
| US Symbols | Show US symbols, otherwise International |